I learned the following information from Larry Lauman's Cool Links site (Blackcloud) which is my favorite link site. It has all you need if you haven't checked it out. Particularly this link:
http://cdip.ucsd.edu/?nav=recent&sub...m=tpo_forecast
(linked from
http://larryl.com/favorite_kayak_conditions.htm)
I've found it's data plots and info is almost perfect.
The way it works(again I thank Blackcloud's site for this info):
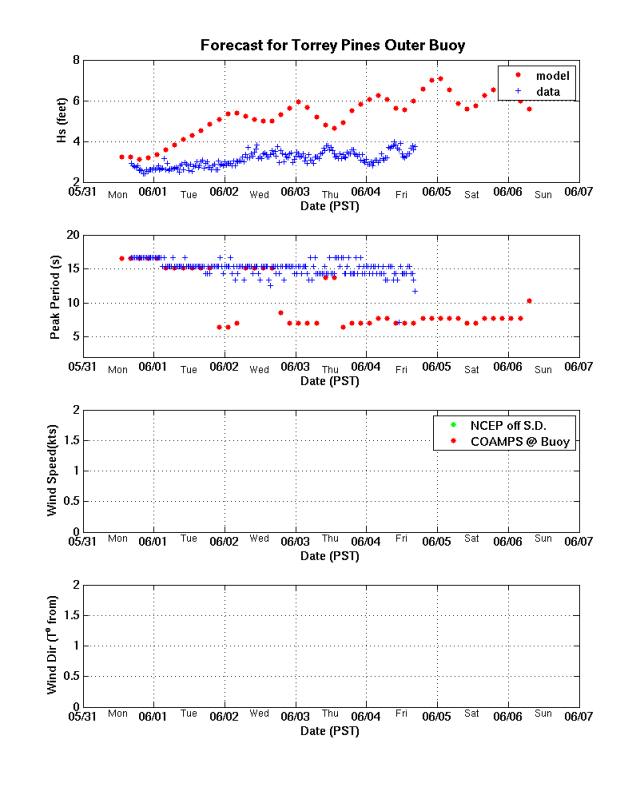
Basically the smaller the peak periods and the higher the waves the worst it's going to be.
But if the peak period is real high like 15 seconds and above, it almost doesn't matter how big the waves are plotting at, the Launch will have very small waves. I've seen 12 ft+ waves being plotted on this, but the launch was a pond, because the intervals were so high.
At the time that I'm writing this the forecast-ed wave height is about 6 ft.
It's being plotted at just under 4ft
The peak period is being forecast-ed at around 7 seconds
But it's plotting out at about 12 seconds and seems to be lowering
Since the peak period is in the higher range of 12 seconds the 4ft waves end up being apparently 1ft or less on the web cam right now(among other factors)